Tracking CTAs since 1994
Annual Correlations of the S&P 500 Price Index and the SG CTA Daily Index
| Year | Correlation | S&P 500 Price Index | SG CTA Daily Index |
| 2000 | -0.24 | -10.13% | 9.56% |
| 2001 | -0.60 | -13.03% | 2.49% |
| 2002 | -0.61 | -23.37% | 12.91% |
| 2003 | 0.11 | 26.39% | 15.75% |
| 2004 | 0.52 | 9.00% | 1.46% |
| 2005 | 0.64 | 3.01% | 3.20% |
| 2006 | 0.49 | 13.65% | 5.75% |
| 2007 | 0.58 | 3.53% | 8.05% |
| 2008 | -0..66 | -38.49% | 13.07% |
| 2009 | -0.05 | 23.45% | -4.30% |
| 2010 | 0.42 | 12.78% | 9.26% |
| 2011 | -0.19 | 0.00% | -4.45% |
| 2012 | -0.34 | 13.41% | -2.87% |
| 2013 | 0.56 | 29.60% | 0.73% |
| 2014 | 0.60 | 11.39% | 15.66% |
| 2015 | -0.04 | -0.73% | 0.03% |
| 2016 | -0.42 | 9.54% | -2.87% |
| 2017 | 0.36 | 19.42% | 2.48% |
| 2018 | 0.38 | -6.24% | -5.83% |
| 2019 | 0.10 | 28.88% | 6.26% |
| 2020 | 0.28 | 16.26% | 3.16% |
| 2021 | 0.49 | 26.89% | 6.17% |
| 2022 | -0.49 | -18.11% | 19.86% |
| 2023 | -0.52 | 26.29% | 3.92% |
The addition of managed futures to a client's portfolio does not mean that a portfolio will be profitable or that it will not experience substantial losses and that the studies conducted in the past may not be indicative of current time periods or of the performance of any individual CTA.
The Benefits of Managed Futures
A well balanced managed futures portfolio can provide a diversified global investment opportunity for investors. The main benefits include:
- Opportunity to reduce the volatility risk of a portfolio
- Opportunity to enhance a portfolio's returns
- The ability to profit in both rising and falling markets
- The opportunity the participate in global markets
Read More about the Benefits of Managed Futures
The addition of managed futures to a client's portfolio does not mean that a portfolio will be profitable or that it will not experience substantial losses and that the studies conducted in the past may not be indicative of current time periods or of the performance of any individual CTA.
The Effect of Reallocating to Managed Futures1
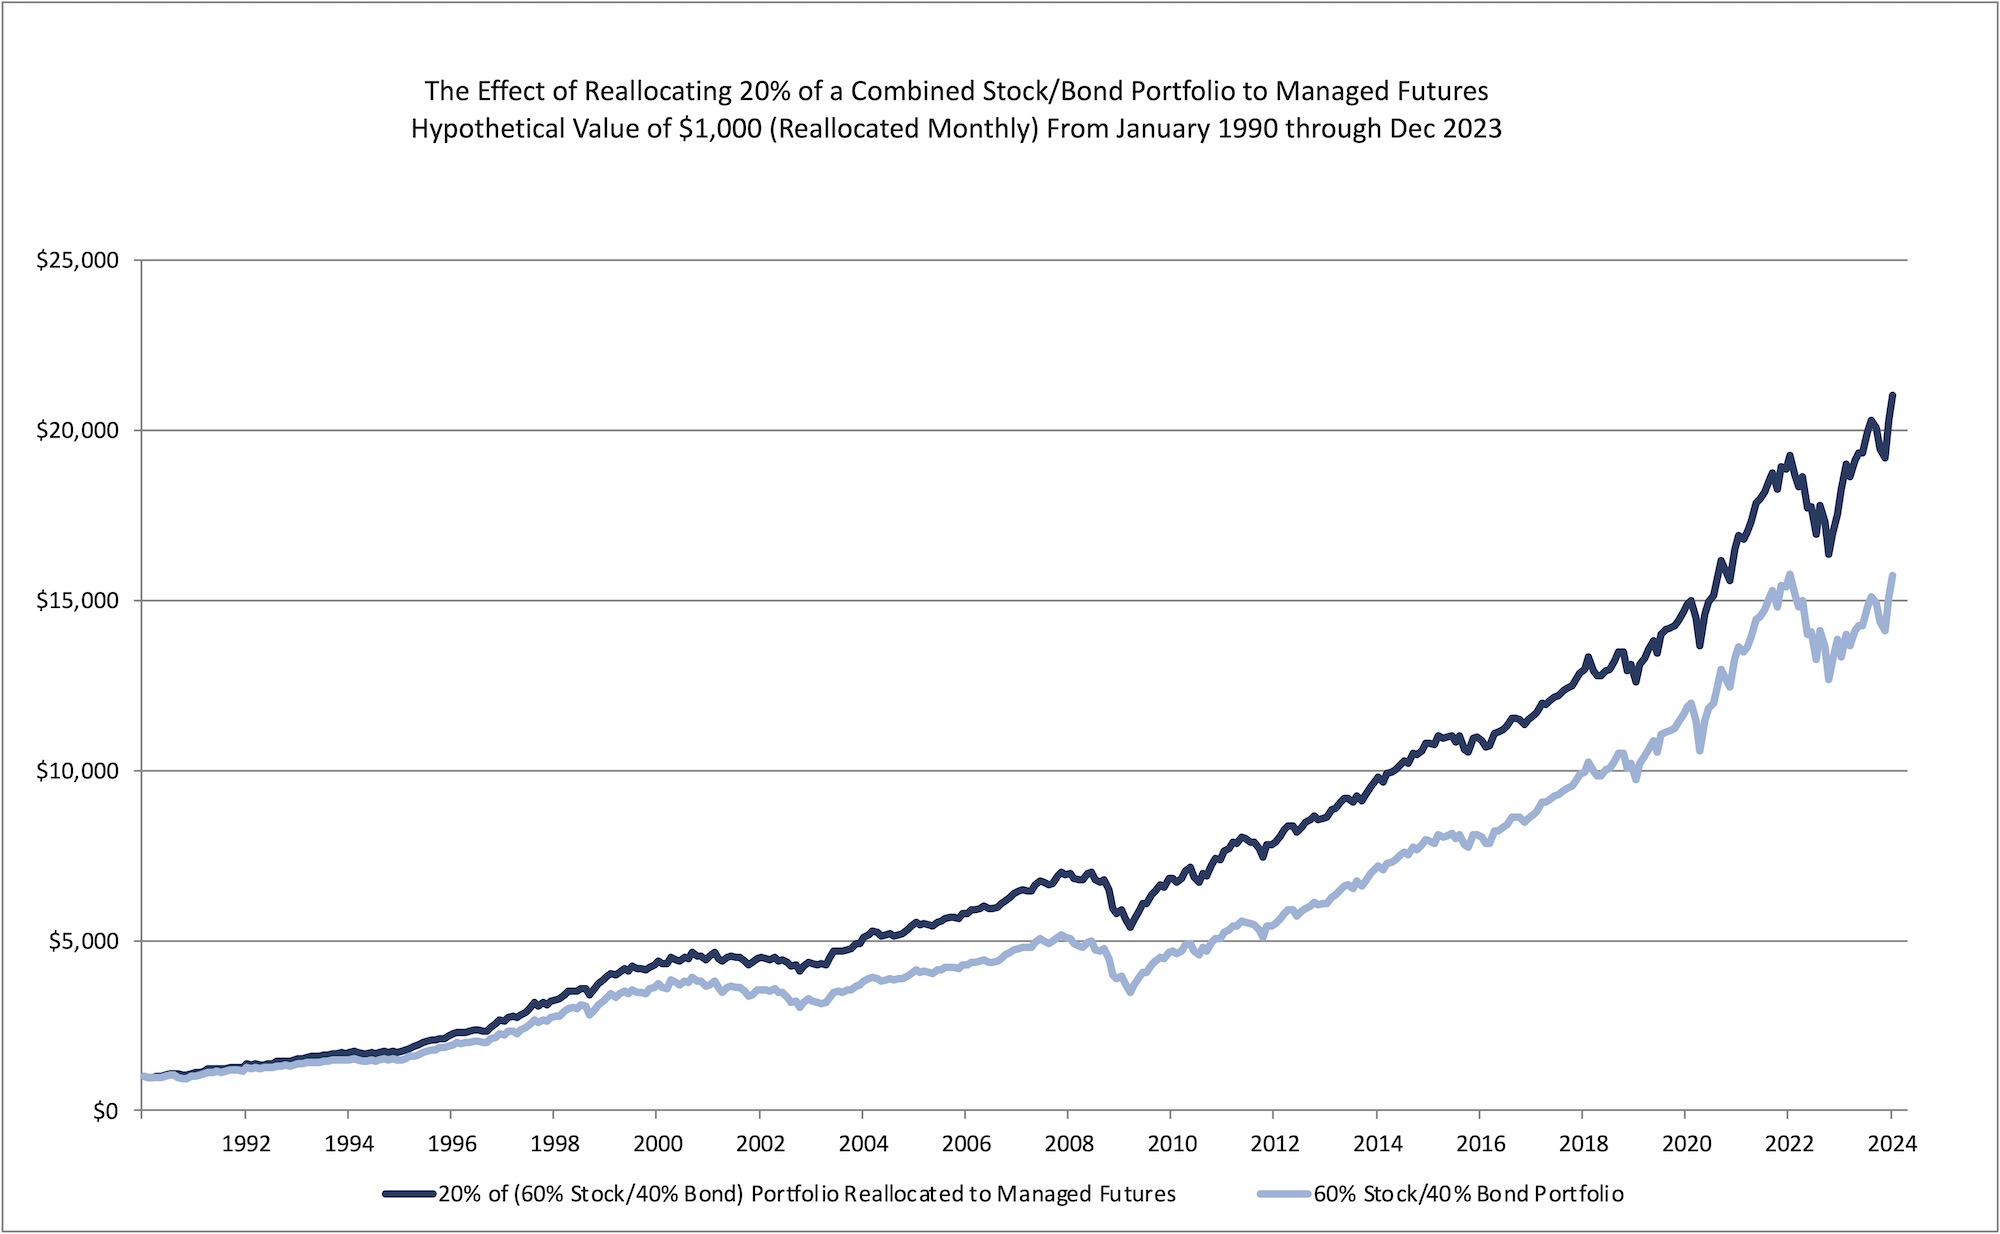
1. Reallocation Footnotes
Stocks are represented by the S&P 500 Total Return Index from December 1990 to the end of Data and by the S&P 500 Price Index adjusted for dividends from January 1990 through November 1990. The S&P 500 indices are designed to reflect all sectors of the U.S. equity markets. The S&P 500 includes 500 blue chip, large cap stocks, which together represent about 75% of the total U.S. equities market. Companies eligible for addition to the S&P 500 have market capitalization of at least US$3.5 billion. The TR Index accounts for the reinvestment of dividends.
From January 2022 to present Bonds are represented by the S&P 500 US Bond Index. The S&P 500 Bond Index is designed to be a corporate-bond counterpart to the S&P 500. This market value-weighted index seeks to measure the performance of U.S. corporate debt issued by constituents in the S&P 500. From Jan 1990 to Dec 2021 Bonds are represented by the Bloomberg US Aggregate Bond Index (formerly known as the Barclay's US Aggregate Bond Index and as the Lehman US Aggregate Bond Index). The U.S. Bond Index is a broad-based benchmark that measures the investment grade, U.S. dollar-denominated, fixed-rate taxable bond market, including Treasuries, government-related and corporate securities, MBS (agency fixed-rate and hybrid ARM pass- throughs), ABS, and CMBS.
Managed Futures are represented by the Autumn Gold CTA Index. The Autumn Gold CTA Index is comprised of the client performance of all CTA programs included in the AG database and does not represent the complete universe of CTAs. CTA programs with proprietary performance are not included. Monthly numbers are updated until 45 days after the end of the month.
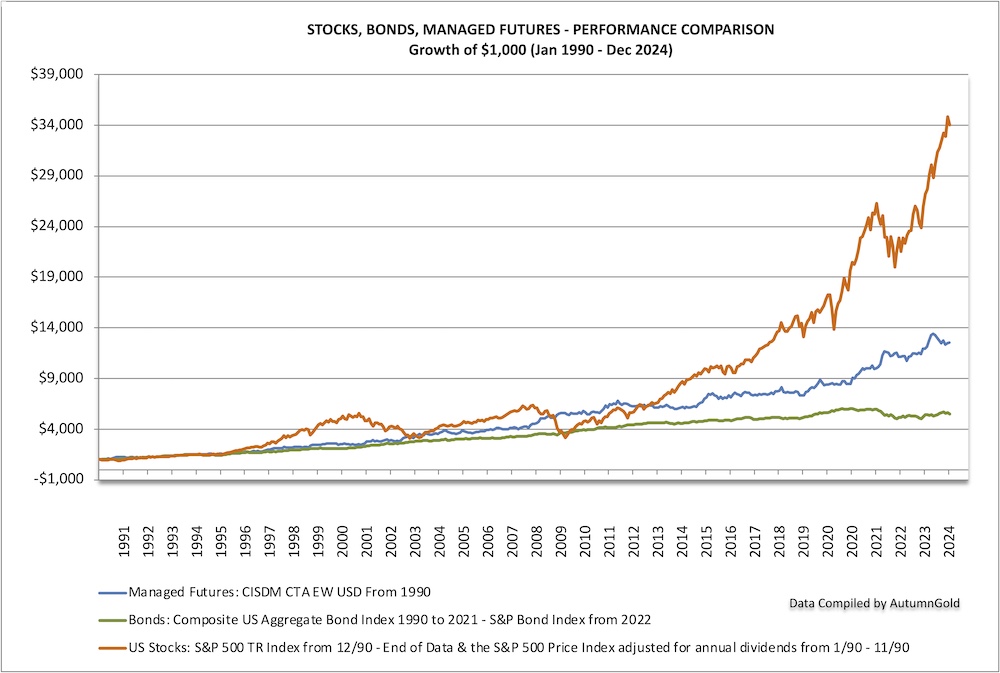
Managed Futures vs. U.S. Stocks vs. International Stocks2

2. MF vs. US & International Stock Footnotes
The S&P 500 indices are designed to reflect all sectors of the U.S. equity markets. The S&P 500 includes 500 blue chip, large cap stocks, which together represent about 75% of the total U.S. equities market. Companies eligible for addition to the S&P 500 have market capitalization of at least US$3.5 billion. The TR Index accounts for the reinvestment of dividends.
The MSCI EAFE Index (Europe, Australasia, Far East) is a free float-adjusted market capitalization index that is designed to measure the equity market performance of developed markets, excluding the US & Canada. The MSCI EAFE Index consists of the following 22 developed market country indices: Australia, Austria, Belgium, Denmark, Finland, France, Germany, Greece, Hong Kong, Ireland, Israel, Italy, Japan, the Netherlands, New Zealand, Norway, Portugal, Singapore, Spain, Sweden, Switzerland, and the United Kingdom. As of May 30, 2011.
Managed Futures is represented by the CISDM Equal Weighted CTA Index. The CISDM Equal Weighted CTA Index is an equal weighted index of CTAs maintained by The Center for International Securities and Derivatives Markets at the University of Massachusetts Amherst. It reflects the average performance of Commodity Trading Advisors reporting to the CISDM Hedge Fund/CTA Database. Each CTA must have at least $500,000 under management and at least a 12-month track record.
Managed Futures vs. Stocks & Bonds3
3. MF vs. Stocks & Bonds Footnotes
The S&P 500 indices are designed to reflect all sectors of the U.S. equity markets. The S&P 500 includes 500 blue chip, large cap stocks, which together represent about 75% of the total U.S. equities market. Companies eligible for addition to the S&P 500 have market capitalization of at least US$3.5 billion. The TR Index accounts for the reinvestment of dividends.
From Jan 2022 to present Bonds are represented by the S&P 500 US Bond Index. The S&P 500 Bond Index is designed to be a corporate-bond counterpart to the S&P 500. This market value-weighted index seeks to measure the performance of U.S. corporate debt issued by constituents in the S&P 500. From Jan 1990 to Dec 2021 Bonds are represented by the Bloomberg US Aggregate Bond Index (formerly known as the Barclay's US Aggregate Bond Index and as the Lehman US Aggregate Bond Index). The U.S. Bond Index is a broad-based benchmark that measures the investment grade, U.S. dollar-denominated, fixed-rate taxable bond market, including Treasuries, government-related and corporate securities, MBS (agency fixed-rate and hybrid ARM pass- throughs), ABS, and CMBS.
Managed Futures is represented by the CISDM Equal Weighted CTA Index. The CISDM Equal Weighted CTA Index is an equal weighted index of CTAs maintained by The Center for International Securities and Derivatives Markets at the University of Massachusetts Amherst. It reflects the average performance of Commodity Trading Advisors reporting to the CISDM Hedge Fund/CTA Database. Each CTA must have at least $500,000 under management and at least a 12-month track record.
Critical Events4
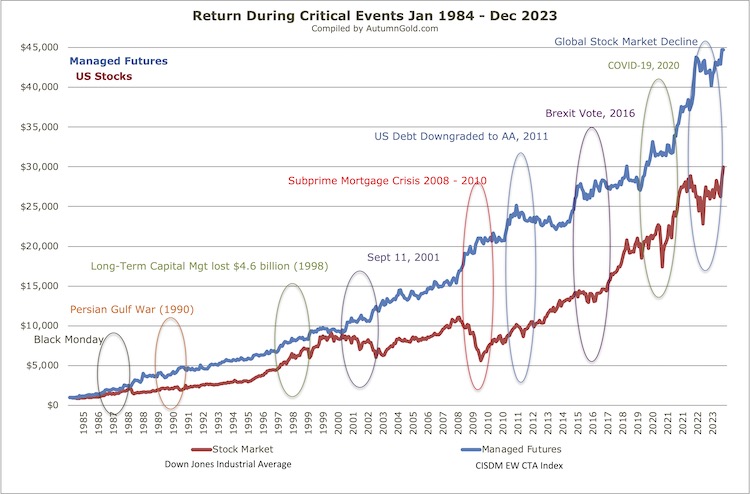
4. Critcial Events Footnotes
The Dow Jones Industrial Average is a price-weighted average of 30 blue-chip stocks that are generally the leaders in their industry. It has been a widely followed indicator of the stock market since October 1, 1928.
Managed Futures is represented by the CISDM Equal Weighted CTA Index. The CISDM Equal Weighted CTA Index is an equal weighted index of CTAs maintained by The Center for International Securities and Derivatives Markets at the University of Massachusetts Amherst. It reflects the average performance of Commodity Trading Advisors reporting to the CISDM Hedge Fund/CTA Database. Each CTA must have at least $500,000 under management and at least a 12-month track record.
Omega5
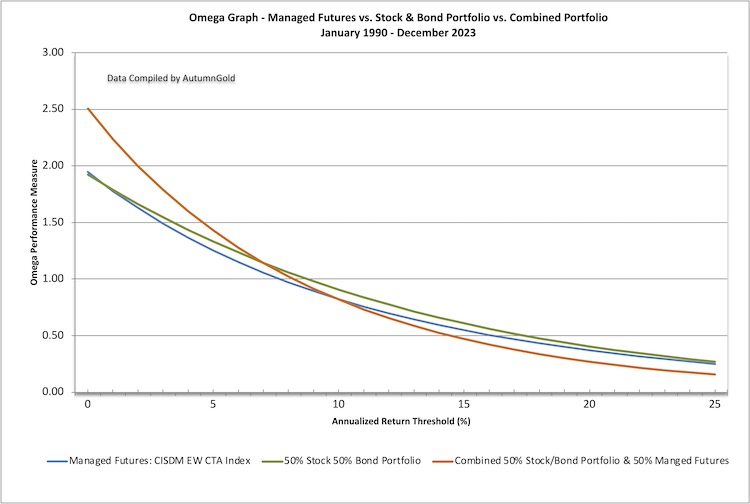
5. The Omega Function
The Omega Function accounts for the non-normal distributions of returns and takes into account the investor's preferences for loss and gain. Omega is computed directly from the returns distribution and measures the total impact of the moments instead of each one of them individually. The flatter the line the greater the risk.
Stocks are represented by the S&P 500 Total Return Index from December 1990 to the end of Data and by the S&P 500 Price Index adjusted for dividends from January 1990 through November 1990. The S&P 500 indices are designed to reflect all sectors of the U.S. equity markets. The S&P 500 includes 500 blue chip, large cap stocks, which together represent about 75% of the total U.S. equities market. Companies eligible for addition to the S&P 500 have market capitalization of at least US$3.5 billion. The TR Index accounts for the reinvestment of dividends.
From Jan 2022 to present Bonds are represented by the S&P 500 US Bond Index. The S&P 500 Bond Index is designed to be a corporate-bond counterpart to the S&P 500. This market value-weighted index seeks to measure the performance of U.S. corporate debt issued by constituents in the S&P 500. From Jan 1990 to Dec 2021 Bonds are represented by the Bloomberg US Aggregate Bond Index (formerly known as the Barclay's US Aggregate Bond Index and as the Lehman US Aggregate Bond Index). The U.S. Bond Index is a broad-based benchmark that measures the investment grade, U.S. dollar-denominated, fixed-rate taxable bond market, including Treasuries, government-related and corporate securities, MBS (agency fixed-rate and hybrid ARM pass- throughs), ABS, and CMBS.
Managed Futures is represented by the CISDM Equal Weighted CTA Index. The CISDM Equal Weighted CTA Index is an equal weighted index of CTAs maintained by The Center for International Securities and Derivatives Markets at the University of Massachusetts Amherst. It reflects the average performance of Commodity Trading Advisors reporting to the CISDM Hedge Fund/CTA Database. Each CTA must have at least $500,000 under management and at least a 12-month track record.
CTA INDEXES DO NOT REPRESENT THE COMPLETE UNIVERSE OF CTAS. INVESTORS SHOULD NOTE THAT IT IS NOT POSSIBLE TO INVEST IN THESE INDEXES.
The addition of managed futures to a client's portfolio does not mean that a portfolio will be profitable or that it will not experience substantial losses and that the studies conducted in the past may not be indicative of current time periods or of the performance of any individual CTA.
Risk Disclosure
PAST PERFORMANCE IS NOT NECESSARILY INDICATIVE OF FUTURE RESULTS.
THIS MATTER IS INTENDED AS A SOLICITATION FOR MANAGED FUTURES. THE RISK OF TRADING COMMODITY FUTURES, OPTIONS AND/OR FOREIGN EXCHANGE ("FOREX") IS SUBSTANTIAL. THE HIGH DEGREE OF LEVERAGE ASSOCIATED WITH COMMODITY FUTURES, OPTIONS AND FOREX CAN WORK AGAINST YOU AS WELL AS FOR YOU. THIS HIGH DEGREE OF LEVERAGE CAN RESULT IN SUBSTANTIAL LOSSES, AS WELL AS GAINS. YOU SHOULD THEREFORE CAREFULLY CONSIDER WHETHER SUCH TRADING IS SUITABLE FOR YOU IN LIGHT OF YOUR FINANCIAL CONDITION. IF YOU ARE UNSURE YOU SHOULD SEEK PROFESSIONAL ADVICE. AN INVESTOR MUST READ AND UNDERSTAND THE CTA’S CURRENT DISCLOSURE DOCUMENT BEFORE INVESTING. THERE ARE NO GUARANTEES OF PROFIT NO MATTER WHO IS MANAGING YOUR MONEY.
PAST PERFORMANCE DOES NOT GUARANTEE FUTURE SUCCESS. IN SOME CASES MANAGED ACCOUNTS ARE CHARGED SUBSTANTIAL COMMISSIONS AND ADVISORY FEES. THOSE ACCOUNTS SUBJECT TO THESE CHARGES, MAY NEED TO MAKE SUBSTANTIAL TRADING PROFITS JUST TO AVOID DEPLETION OF THEIR ASSETS. EACH COMMODITY TRADING ADVISOR ("CTA") IS REQUIRED BY THE COMMODITY FUTURES TRADING COMMISSION ("CFTC") TO ISSUE TO PROSPECTIVE CLIENTS A RISK DISCLOSURE DOCUMENT OUTLINING THESE FEES, CONFLICTS OF INTEREST AND OTHER ASSOCIATED RISKS. A HARD COPY OF THESE RISK DISCLOSURE DOCUMENTS ARE READILY AVAILABLE BY CLICKING ON EACH CTA'S "REQUEST DISCLOSURE DOCUMENT" BUTTON.
THE FULL RISK OF COMMODITY FUTURES, OPTIONS AND FOREX TRADING CAN NOT BE ADDRESSED IN THIS RISK DISCLOSURE STATEMENT. NO CONSIDERATION TO INVEST SHOULD BE MADE WITHOUT THOROUGHLY READING THE DISCLOSURE DOCUMENT OF EACH OF THE CTAS IN WHICH YOU MAY HAVE AN INTEREST. REQUESTING A DISCLOSURE DOCUMENT PLACES YOU UNDER NO OBLIGATION AND EACH DOCUMENT IS PROVIDED AT NO COST. THE CFTC HAS NOT PASSED UPON THE MERITS OF PARTICIPATING IN ANY OF THE FOLLOWING PROGRAMS NOR ON THE ADEQUACY OR ACCURACY OF THE DISCLOSURE DOCUMENTS. OTHER DISCLOSURE STATEMENTS ARE REQUIRED TO BE PROVIDED TO YOU BEFORE AN ACCOUNT MAY BE OPENED FOR YOU.
PAST PERFORMANCE IS NOT NECESSARILY INDICATIVE OF FUTURE RESULTS. PROSPECTIVE CLIENTS SHOULD NOT BASE THEIR DECISION ON INVESTING IN THIS TRADING PROGRAM SOLELY ON THE PAST PERFORMANCE PRESENTED. ADDITIONALLY, IN MAKING AN INVESTMENT DECISION, PROSPECTIVE CLIENTS MUST ALSO RELY ON THEIR OWN EXAMINATION OF THE PERSON OR ENTITY MAKING THE TRADING DECISIONS AND THE TERMS OF THE ADVISORY AGREEMENT INCLUDING THE MERITS AND RISKS INVOLVED.
AUTUMN GOLD CTA INDEXES ARE NON-INVESTABLE INDEXES COMPRISED OF THE CLIENT PERFORMANCE OF CTA PROGRAMS INCLUDED IN THE AUTUMN GOLD DATABASE AND DO NOT REPRESENT THE COMPLETE UNIVERSE OF CTAS. INVESTORS SHOULD NOTE THAT IT IS NOT POSSIBLE TO INVEST IN THESE INDEXES.
All rights reserved.